Four-panel dashboard for a single CPLASS-segmented trajectory
Source:R/plot.R
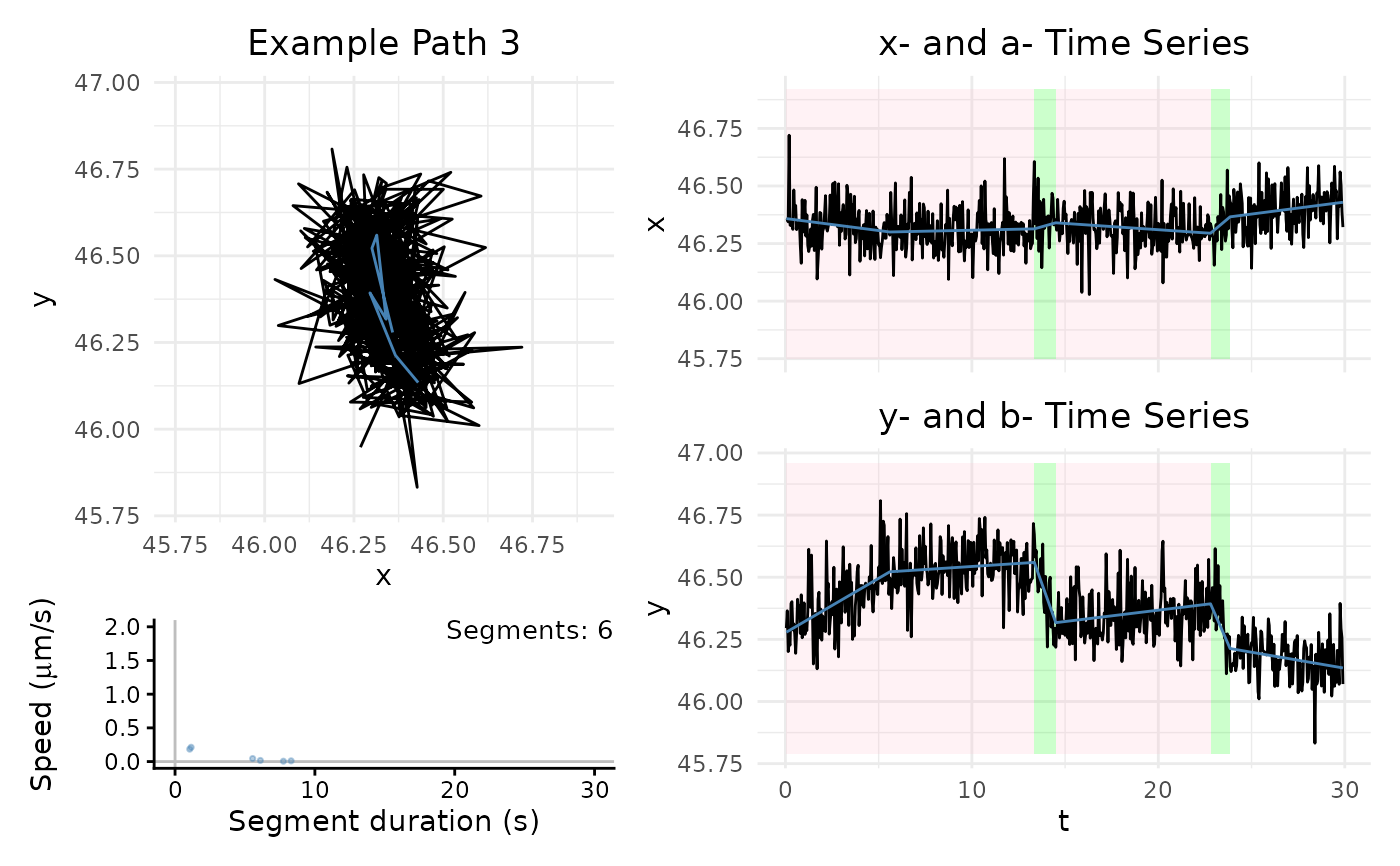
plot_path_inferred.RdShows the x-y path with inferred anchor overlay, the x(t) and y(t) time series with motile/stationary shading, and a duration-vs-speed scatter of inferred segments.
Usage
plot_path_inferred(
  path_info,
  xy_width = NA,
  t_lim = NA,
  motor,
  max_speed,
  state_shaded = TRUE,
  title_ind = TRUE,
  show_time_changes = FALSE,
  path_index = NULL
)
Arguments
- path_info
CPLASS output for one path (`path_inferred`, `segments_inferred`).
- xy_width
width of the x-y panel; computed automatically if `NA`.
- t_lim
time-axis limits; computed automatically if `NA`.
- motor
label used in the plot title.
- max_speed
upper limit for the speed axis in the duration/speed panel.
- state_shaded
logical; shade motile/stationary segments. Default `TRUE`.
- title_ind
logical; include a path index in the title. Default `TRUE`.
- show_time_changes
logical; draw vertical lines at changepoints instead of state shading. Default `FALSE`.
- path_index
optional explicit path index/label for the title (see Details in package overview about the original's implicit `i` lookup).
Examples
# \donttest{
data_file <- system.file("extdata", "Real_21_Periphery.csv", package = "cplass")
traj <- read.csv(data_file)
path <- traj[traj$index_path == 3, ]
fit <- CPLASS(path$t, path$x, path$y, iter_max = 2000, burn_in = 200,
show_progress = FALSE)
plot_path_inferred(fit, motor = "Example", max_speed = 2, path_index = 3)
#> Warning: Removed 1 row containing missing values or values outside the scale range
#> (`geom_path()`).
#> Warning: Removed 1 row containing missing values or values outside the scale range
#> (`geom_path()`).
#> Warning: Removed 1 row containing missing values or values outside the scale range
#> (`geom_path()`).
#> Warning: Removed 1 row containing missing values or values outside the scale range
#> (`geom_path()`).
 # }
# }